
Most SEO forecasts fail before the meeting even ends.
Not because the data is wrong. Not because the strategy is weak. They fail because the numbers land without context, the assumptions go unexplained, and leadership leaves the room wondering what any of it means for the business.
If you want your SEO forecast to earn budget, build trust, and drive decisions, you need to present it in a language stakeholders actually understand. That means translating traffic projections into revenue, showing clear scenarios, and grounding every number in verifiable logic.
This guide walks you through exactly how to present SEO forecasts to stakeholders – step by step.
Why Most SEO Forecasts Lose the Room
Before building a better forecast, understand why most presentations fall flat.
Stakeholders – especially finance directors, CEOs, and sales leads – are not SEO specialists. They do not think in terms of impressions, keyword rankings, or domain authority. They think in terms of revenue, leads, pipeline, and return on investment.
When an SEO presents a chart showing keyword movement from position 8 to position 3, a stakeholder’s natural response is: “So what?” That question is fair. The SEO team may see enormous potential in that shift, but without context, the number is meaningless to a boardroom.
Moreover, stakeholders have seen forecasts go wrong before. Polished slide decks with traffic projections that never materialized. Revenue estimates were built on assumptions no one could explain. This history creates skepticism, and you need to address it directly.
The solution is not more data. It is a better framing. Understanding what SEO lead generation is and how organic traffic connects to the pipeline is the foundation of a forecast that stakeholders will respect.
Step 1 – Start with Business Outcomes, Not Rankings
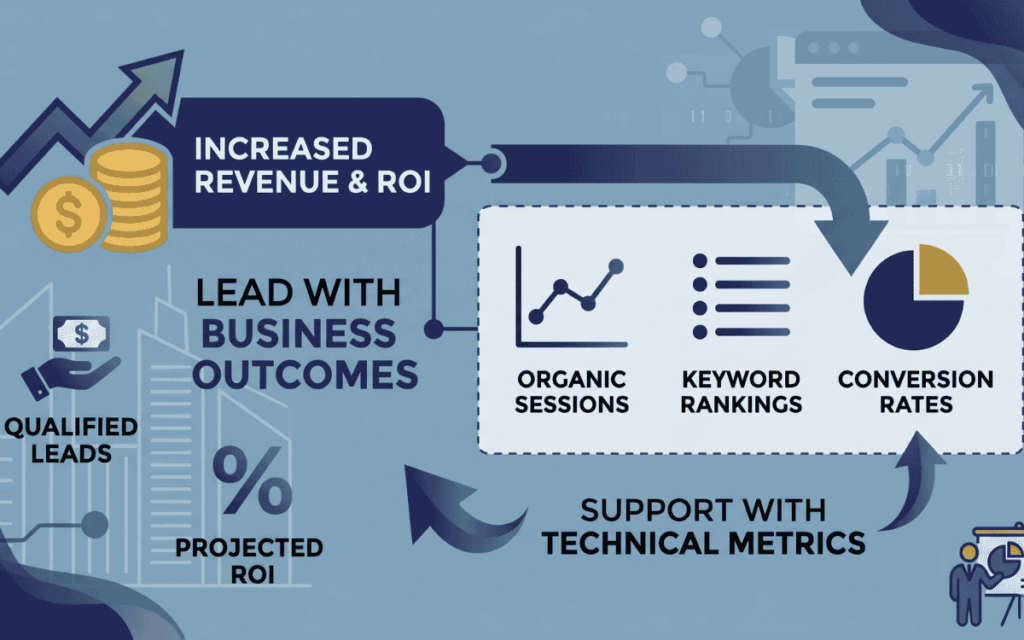
The first rule of presenting SEO forecasts to stakeholders is to lead with business outcomes.
Never open a forecast with keyword rankings or organic session counts. Instead, open with the commercial question your forecast answers:
- How much additional revenue could this SEO investment generate?
- How many qualified leads can we realistically expect?
- What is the projected ROI over the next six to twelve months?
This framing immediately establishes that SEO is a business channel – not a technical exercise. It also puts you in the same conversation as paid media, sales, and other channels that leadership already measures by revenue.
Once the business question is clear, you can walk backwards through the data to explain how you arrived at your projection. Rankings, traffic, and conversion rates all become supporting evidence rather than the headline.
Step 2 – Build a Three-Scenario Model
Never walk into a boardroom with a single traffic projection.
A single number sets a trap. Leadership treats it as a guarantee. When the reality lands anywhere below that number – even slightly – you lose credibility. Instead, structure your forecast around three distinct scenarios:
Conservative Scenario: This is the floor. It assumes slower-than-expected ranking improvements, lower click-through rates, and your historical minimum conversion rate. This scenario protects you from overpromising and shows stakeholders what happens if conditions are challenging.
Base Case Scenario: This is the most likely outcome. It uses realistic ranking timelines, standard CTR assumptions adjusted for modern SERP features, and your average historical conversion rate. This is the number you anchor your recommendation around.
Aggressive Scenario: This is the ceiling. It assumes you capture the maximum viable ranking opportunities, slightly improved CTR through optimized meta descriptions and titles, and a conversion rate that reflects your best-performing page templates.
Presenting three scenarios does something powerful: it shifts the conversation from “will this work?” to “how much do we want to invest?” That is a much more productive discussion.
If you are pitching SEO services for organic traffic to a client or internal leadership, the three-scenario model gives them control over the outcome rather than just a number to accept or reject.
Step 3 – Translate Traffic into Leads and Revenue
Traffic projections alone will not move a CFO or sales director. You must translate sessions into the pipeline.
Here is a simple formula that works:
Projected Traffic × Conversion Rate = Estimated Leads. Estimated Leads × Close Rate × Average Deal Value = Projected Revenue
This formula is straightforward enough for any stakeholder to follow and challenge. That is exactly what you want. When a stakeholder pushes back on your close rate or average deal value, they are engaging with your forecast – and that engagement builds confidence in the process.
A few important rules when applying this formula:
- Never use a single sitewide conversion rate. A commercial service page converts very differently from a top-of-funnel blog post. Split your conversion assumptions by page type and search intent.
- Use historical data from your own site wherever possible. Invented benchmarks are easy to dismiss.
- Account for lead quality. Organic leads from high-intent commercial pages are worth more than informational traffic. Show this distinction in your model.
For B2B companies, this is especially important. In longer sales cycles, SEO often influences the pipeline before it shows up as closed revenue. Understanding organic traffic strategies for SaaS businesses means accounting for multi-touch attribution and assisted conversions in your forecast presentation.
Step 4 – Make Every Assumption Visible
The most trusted forecasts are not the ones with the biggest numbers. They are the ones where every assumption is visible and explainable.
Before presenting, document and be ready to defend these inputs:
- Organic baseline – your current monthly organic traffic and leads
- Target keywords and their current positions – what you are starting from
- Expected visibility uplift – realistic ranking improvements over the forecast period
- CTR assumptions – adjusted for zero-click searches and AI Overviews where relevant
- Conversion rate by page type – not a blended average
- Lead-to-sale rate – pulled from CRM or sales data
- Average revenue per sale – agreed with finance or sales beforehand
- Timeline – when you expect each phase of impact to materialize
When assumptions are on the table, a stakeholder can say, “I think our close rate is actually lower than that.” That conversation improves the forecast and increases buy-in. Hidden assumptions, on the other hand, create distrust the moment something doesn’t land as projected.
This level of transparency is also important when you consider content performance data – the forecast is only as good as the historical data feeding it.
Step 5 – Account for SEO’s Realistic Timeline
One of the most common points of executive pushback is timing.
Stakeholders accustomed to paid advertising expect fast results. SEO does not work that way. Early momentum typically appears within three to six months. However, a consistent, significant return generally requires six to twelve months of sustained activity.
If you do not address this upfront, you will face anxious check-ins at month three when traffic has not spiked. This damages trust before the strategy even has a chance to deliver.
Instead, address the timeline directly in your presentation:
- Show a month-by-month traffic curve that accounts for indexing delays
- Agree on leading indicators to track early – impressions, crawl rates, indexed pages
- Set a clear milestone for when you expect the base case traffic to materialize
- Explain what you will report on before that milestone to show progress
When you make the timeline transparent and pair it with early indicators that stakeholders can track, you replace anxiety with confidence. This directly connects to how long SEO takes to work – setting this expectation early is critical to maintaining trust throughout the campaign.
Step 6 – Address SERP Volatility and AI Overviews
Modern SEO forecasts must account for a search environment that is changing rapidly.
Nearly 60% of Google searches now result in zero clicks. AI Overviews appear for a growing number of queries, especially informational ones, absorbing clicks that would previously have gone to organic results. If your forecast does not account for this, it will overestimate traffic for informational content clusters.
Here is how to handle this in your presentation:
- Apply a volatility discount to informational keyword CTR assumptions. If a query triggers an AI Overview or featured snippet, reduce the expected click yield by 30–50%, depending on the layout.
- Focus commercial traffic forecasts on high-intent keywords where users are less likely to find a complete answer in a snippet.
- Explain to stakeholders that rankings and visibility have value even when clicks decline, because brand mentions in AI Overviews build awareness and trust.
Addressing this proactively demonstrates that your forecast reflects the real search landscape – not an idealized 2019 version of it. It also shows stakeholders that you understand how AI Overviews are changing SEO and have planned accordingly.
Step 7 – Present the Forecast Visually
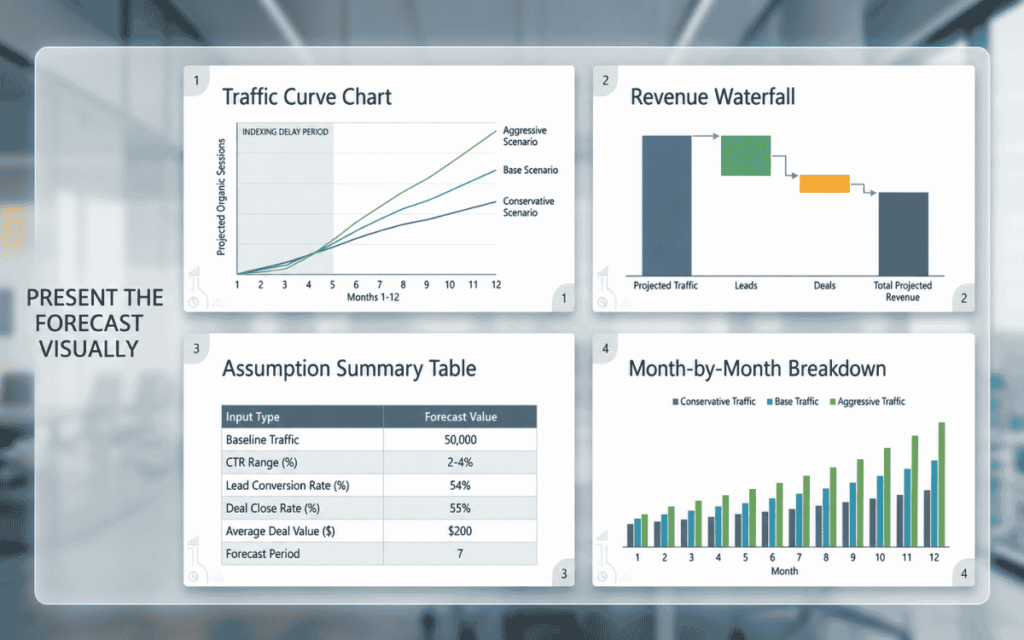
Numbers in a table are hard to internalize. Visuals make the story immediate.
Use these formats to present your forecast clearly:
Traffic Curve Chart: Show the three scenarios – conservative, base, aggressive – as separate lines on a single chart. Use a timeline on the X-axis (months) and projected organic sessions on the Y-axis. Include the indexing delay period as a shaded zone to set expectations.
Revenue Waterfall: Visualize how projected traffic converts into leads, then into deals, then into revenue. This helps stakeholders follow the logic step by step rather than jumping straight to the bottom-line number.
Assumption Summary Table: A clean one-page table showing every key input – baseline traffic, CTR range, conversion rate, close rate, average deal value, and forecast period. This becomes the reference point for any questions during the presentation.
Month-by-Month Breakdown: Show how impact builds over the forecast period. This is especially important for managing timeline expectations and identifying when each scenario’s traffic curve begins to diverge.
Keep slides clean. Remove jargon. Every slide should answer one question that a non-SEO stakeholder might ask.
Step 8 – Connect the Forecast to a Content and Resource Plan
A traffic projection without a production plan is incomplete.
If your forecast projects a 25% increase in organic sessions, be ready to answer: “What exactly do we need to do to achieve that?” Stakeholders will ask. If you cannot answer, the forecast loses credibility immediately.
Your content and resource plan should include:
- Number of new pages or posts required – calculated from your average traffic yield per asset
- Technical SEO work needed – site speed, crawlability, internal linking improvements
- Timeline for production – staggered to account for indexing delays
- Team or agency resources required – writers, developers, SEO specialists
- Budget breakdown – cost per expected lead or acquisition
This transforms your forecast from a prediction into a project plan. Leadership can now see exactly what they are investing in and what operational output they will receive in exchange.
For businesses evaluating whether to hire an SEO company, this level of detail in a forecast presentation directly demonstrates the value and rigor behind a proposed engagement.
How SurgeAIO Can Help in Terms of SEO
Building a credible SEO forecast requires reliable data, accurate keyword intelligence, and clear visibility tracking. This is where SurgeAIO becomes a genuine advantage.
SurgeAIO is an all-in-one SEO and AI visibility platform designed to support every stage of the forecasting and reporting process:
Keyword and Opportunity Research – SurgeAIO helps you identify the realistic ranking opportunities that should form the basis of your forecast. Rather than projecting from raw search volume, you can target achievable positions based on competitive gap analysis and keyword difficulty.
AI Visibility Tracking – As AI Overviews and large language models reshape how content is discovered, SurgeAIO tracks your brand’s visibility and citation frequency across major LLMs. This allows you to include AI search performance in your forecast – an increasingly important signal for stakeholders.
Content Performance Data – SurgeAIO monitors how your existing content performs over time, giving you the historical conversion and traffic data needed to build credible input assumptions for your revenue model.
Competitive Analysis – Understanding where competitors are vulnerable helps you anchor your forecast to realistic weak-spot opportunities rather than theoretical keyword maximums. SurgeAIO’s competitive analysis tools make this straightforward.
Reporting and Dashboards – Once a campaign is underway, SurgeAIO tracks actual performance against your forecast, giving you the reporting data needed to update assumptions and demonstrate progress to stakeholders month by month.
With the right tools behind your forecast, every number becomes defensible – and every stakeholder conversation becomes easier.
Quick Checklist: Before You Present
Use this checklist to ensure your forecast is stakeholder-ready:
- [ ] Forecast opens with a business outcome, not a keyword ranking
- [ ] Three scenarios included – conservative, base case, aggressive
- [ ] Traffic projections converted into leads and revenue
- [ ] Every assumption documented and explainable
- [ ] Timeline includes indexing delay and leading indicators
- [ ] CTR assumptions account for zero-click and AI Overview impact
- [ ] Visuals are clean, jargon-free, and self-explanatory
- [ ] Content and resource plan attached to the forecast
- [ ] Historical data used to validate conversion and close rate inputs
Final Thoughts
Presenting SEO forecasts to stakeholders is as much a communication skill as it is a technical one.
The numbers matter. However, how you frame them, structure them, and connect them to business outcomes matters more. A forecast that speaks in revenue and pipeline terms, shows three clear scenarios, and explains every assumption honestly will earn more trust – and more budget – than a forecast packed with impressive metrics that no one in the room understands.
Therefore, build your forecast with the stakeholder’s question in mind from the start: “What does this investment mean for our business?” Answer that question clearly, back it with data, and present a plan that shows exactly how you will deliver the result.
That is how SEO forecasting earns its seat at the leadership table.
Frequently Asked Questions
Q1. What should an SEO forecast include when presenting to stakeholders?
A complete SEO forecast should include projected organic traffic across three scenarios, conversion rate assumptions by page type, estimated leads and revenue, a clear timeline with indexing delays accounted for, and a content or resource plan showing what work is required to hit the targets.
Q2. How far ahead should an SEO forecast project?
Most forecasts model performance over six to twelve months to account for standard indexing timelines. Projections beyond twelve months carry increasing uncertainty due to algorithm changes and market shifts. A two-year forecast is possible, but it should use wide probability bands and be reviewed quarterly.
Q3. How do I handle stakeholder pushback on SEO timelines?
Address the timeline issue proactively in your presentation. Show a month-by-month traffic curve, agree on early leading indicators to report on – such as impressions, indexed pages, and crawl rates – and explain that SEO returns compound over time rather than delivering immediate spikes like paid advertising.
Q4. Should I use a single conversion rate across all projected traffic?
No. Different page types convert at very different rates. A commercial service page converts far higher than a top-of-funnel blog post. Apply separate conversion rate assumptions to each content category based on your historical data. Blending them creates an inaccurate revenue projection.
Q5. How do AI Overviews affect SEO forecast accuracy?
AI Overviews absorb a significant portion of clicks for informational queries, meaning traditional CTR models overestimate traffic for those keyword types. Apply a volatility discount of 30–50% to informational content CTR assumptions. Focus commercial forecasts on high-intent queries less likely to be answered fully by AI snippets.
Q6. What is the best way to present SEO ROI to a CFO?
Use a simple, transparent formula: projected traffic × conversion rate = leads; leads × close rate × average deal value = revenue. Bring this formula to the meeting and be ready to defend each input using historical data. Avoid jargon, focus on pipeline impact, and show scenarios that allow the CFO to adjust the investment level.
Q7. How often should an SEO forecast be updated?
Review and update your forecast quarterly at a minimum. After major algorithm updates, SERP layout changes, or significant shifts in your site’s technical health, update sooner. Comparing forecasts to actual performance each month keeps assumptions sharp and builds stakeholder confidence over time.